enrollment
Institutional value: Understanding your position among your competitors
Do your prospective students understand the academic value of your institution? How are you positioned among your competitors? One of the first tasks as a college and university consultant is to gain an understanding of an institution’s position among its competitors and work with the campus partners to combine their goals and strategies to match their institutional vision.
In her blog post “Understanding the enrollment motivations of college students,” my colleague Julie Bryant discussed the factors influencing student enrollment decisions across the country, using data from the Student Satisfaction Inventory™ (SSI) . In reviewing data from the thousands of students who completed the SSI, cost, financial aid, and academic reputation were listed as the top three enrollment factors across all institution types.
The relationship between cost, financial aid, and academic reputation can be described as an academic value. The importance that students and families place on academic value in their decision making means it is important to understand these values as you compare your campus with your competitors.
However, in order to have a consistent data set to work with, we first need to look to the National Center for Education Statistics and the IPEDS Data Center. Once home only to institutional researchers, the IPEDS Data Center allows campuses access to a wide range of variables to compare national statistics.
NCES: IPEDS Data Feedback Reports
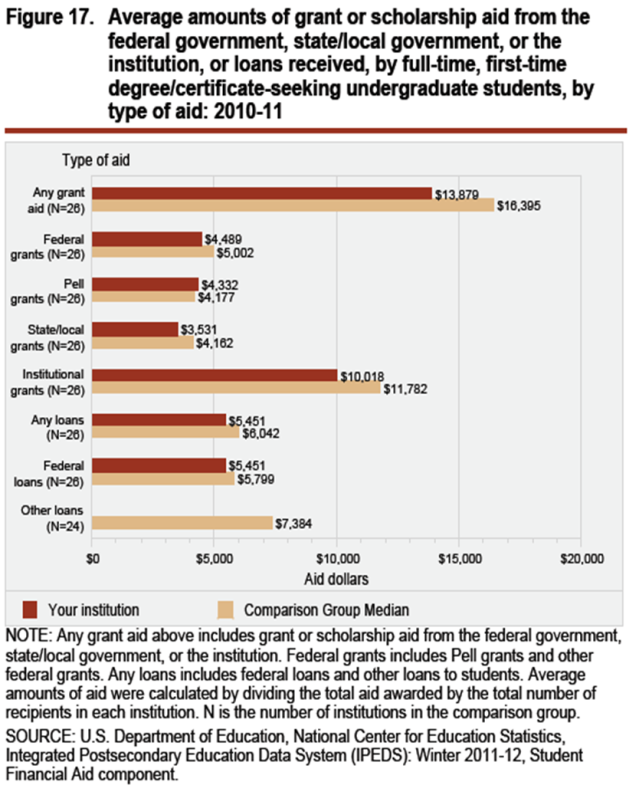
Each institution has a series of data feedback reports already available through the NCES Web site. These reports compare your institution either to a group of peer and aspirant institutions selected by your campus (typically by an institutional researcher), or to a group of institutions selected by IPEDS based on characteristics similar to your institution. Data feedback reports compare your institution to the average of the comparison set. The figure below compares an institution’s financial aid by type (the red bars) to the average level for the comparison group (the tan bars). Data feedback reports include comparisons of enrollment, demographics, admission, test scores, financial aid, graduation rates, faculty salaries, revenues, and endowments.
One benefit of the Data Center at NCES is that you may also select your own custom comparison group. It is not uncommon to find that an institution’s peer and aspirant group is not its competitor set. By choosing your own group of institutions for comparison, you are able begin to understand your relative position to these competitors. You could begin with your cross-application institutions or review the institutions to which your prospective students submit the FAFSA. Each of these institutional groups will provide you with a better understanding of your relative position among your competitors.
NCES: IPEDS Data Extracts and Positioning Reports
Once you have compared your institution to the averages of the group, it is important to compare these same institutions individually by completing a data extract. This process will pull approximately 170 variables of data from IPEDS for each institution, which can then be downloaded into an Excel spreadsheet for use in comparing any of the variables, from retention rate by ethnicity to endowment levels.
Our work with client campuses has focused on comparing institutions based on their academic value. We did this by plotting each institution on a graph using their average net price on the vertical axis and an academic value rating we call “selectivity” on the horizontal axis.
- Selectivity—The selectivity rating is a combination of the institution’s median ACT or SAT score and their first-year retention rate.
- We did consider other combinations of variables (e.g., admission percentage, graduation rate, etc.), but found selectivity was most consistent when comparing institutions of varying sizes and shapes.
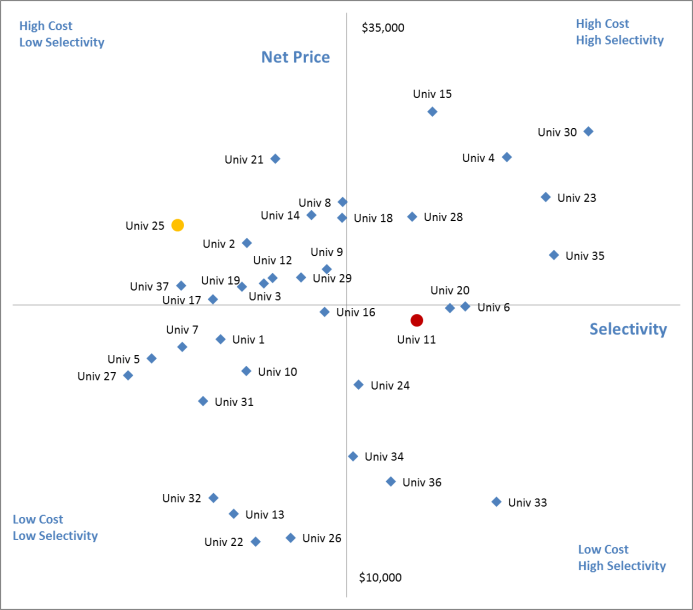
The figure above is a sample positioning chart comparing 37 colleges and universities (labeled “Univ”) throughout the Midwest region.
- If we were completing this graph for Univ 11, we would describe it as a campus with great academic value. They are above average in selectivity and, frankly, a rare value. Assuming this graph includes their primary competitors, Univ 11 is in a good position to market their value and affordability, as well as have more confidence in pricing and leveraging of financial aid. Over time, there would be an opportunity to grow net tuition revenue and, if desired, begin to move the institution toward Univ 28.
- If this graph were for Univ 25, we would have more concern. This institution is academically one of the weaker institutions in its competitor set, yet they have been very successful in maximizing their net tuition revenue. If the institution’s goals were to improve academic quality and retention, we would look at strategies to become more competitive in our merit-based and need-based aid programs. If they were looking to grow enrollment and revenue, we would look at financial aid leveraging through the Enrollment & Revenue Management System™ (ERMS) as well as improving the marketing and branding of the institution to be more competitive in the marketplace through our Noel-Levitz Direct™ service.
Tips for using IPEDS data
- Understand your competitors. Peer and aspirant institutions provide a much different comparison set than the top 20 institutions where prospective students also file a FAFSA.
- If your institution’s competitors cover a range of states or regions, be sure to understand the pricing differences that may occur between states and regions or between rural and urban areas. This can have considerable impact on the net prices and amount of aid being awarded by institutions.
- IPEDS data includes pricing for institutions; however, reporting is usually one year behind. Pricing changes for institutions are very volatile right now, so considering year-old data may not be pertinent for this year’s discussions. There are two main strategies to keep in mind for pricing:
- You may simply set your price based on your internal fiscal needs.
- You may work to understand your position relative to other institutions in your marketplace. You may analyze your price and net price compared to your competitors, the perceptions of prospective students and their families concerning educational value, gaining a better understanding of their willingness and ability to invest in your institution.
If you would like to discuss your institution’s data feedback reports, your institution’s positioning, or learn more about financial aid leveraging, please feel free to contact me at todd-white@noellevitz.com. Good luck with your ongoing recruitment season.
About the Author

Todd White offers nearly 20 years of enrollment management experience. His areas of expertise include strategic planning, admissions, marketing, publications and e-communications development, and financial aid awarding. Previous campus experience Mr. White formerly served as the...
Read more about Todd's experience and expertise
Reach Todd by e-mail at Todd.White@RuffaloNL.com.