enrollment
College website SEO: Tracking your results in Google Analytics
Co-written with Jennifer Croft and Alan Etkin. Jennifer Croft is an SEO consultant with 30 years of marketing experience who has worked on more than 500 websites, including 50 higher education websites. Alan Etkin has extensive experience using web analytics to manage large transactional websites, including 10 years in higher education.
Search engine optimization (SEO) is the single most cost-effective way to drive qualified traffic from prospective students to your campus website. Yet many campuses do not track key search metrics effectively, and either have an incomplete assessment of their search performance or are completely in the dark about it.
Skeptical about how important this is? Try using these tips on how web analytics can measure the return on SEO, and then see how it compares to your other promotional efforts.
If you do not already have a web analytics tool in place, you’ll need to install one first. Google Analytics is the most popular application for web analytics tracking. It’s a free program that can provide most of the metrics you’ll need. We’ll use this as our reference tool for the strategies we’ll discuss.
Keep track of organic traffic
Organic traffic refers to visitors who arrive at your site after clicking on a search result (not one of the paid search ads you see at the top or to the side of your search results). Google Analytics provides an Organic Search Channel Report that tracks how many visits you get from search engines. For an additional level of insight, you can combine this source information with behavior data—for example, how long search visitors stayed on your site, how many pages they clicked, and so on.
Getting around the “not provided” block of keyword phrases
Back in the good old days, Google Analytics tracked the keyword phrases that visitors used to get to your site, and it was easy to separate branded terms from non-branded, and qualified phrases from non-qualified. Beginning in November 2011, however, Google started withholding keyword phrases from users who were logged into a Google account. Then in September 2013, Google completely shut off this flow of information, citing privacy concerns. Yahoo followed suit in January 2014, and as a result, little information remains in this section of Google Analytics.
There are two silver linings to this otherwise dark cloud. First, you can recapture some of that keyword data in Google Webmaster Tools, by looking in the Search Traffic/Search Queries section. Second, if your Google Analytics account has been active for years, you still have a trove of keyword data on hand from before we entered the “not provided” era. You want to be careful about relying on old search data, but it can still provide useful insights into your current SEO strategies.
Use “Page Views” + “Organic Traffic” + “Entrances” + “New Visits” to measure progress
Given that so much keyword phrase data has been eliminated from Google Analytics, you’ll need to focus your measurement efforts in a new direction.
If you perform SEO work on a specific page of your site, you can measure your progress through page views. Bear in mind, though, that an increase in page views could come from a number of factors, including a design update, a change in navigation, or links from other web pages (your own or another website’s).
Also, in user experience studies conducted by Noel-Levitz, we’ve seen that a high percentage of students and prospective students who are already on the site exit temporarily to use Google to find something (rather than using the site’s navigation), then return to the site through a click from Google, skewing your traditional search reports.
To drill down to accurate numbers that correlate with your SEO efforts, you’ll want to look at page views that came from new visits from organic traffic, and, better still, that were entrances from organic traffic.
If the page view came as a new visit from an organic search engine traffic entrance, this means that the visitor came straight from Google (or one of the other search engines) to your page and was visiting for the first time.
Compare year-over-year metrics instead of month-over-month
When studying page views and other key metrics, the most accurate comparisons for higher education sites are year-over-year, not month-over-month. As an example, if you worked on your site in December 2014, then saw organic traffic increase in January 2015, this increase was likely caused by a normal, cyclical spike, not your SEO efforts. The most accurate way to measure progress would be to compare traffic in January 2015 with traffic in January 2014.
Measure visitor engagement
When using any web analytics, it’s important to consider not only raw numbers, but also what they mean in terms of your overall enrollment goals. An increase in organic traffic won’t help boost enrollment, for example, unless that traffic is qualified traffic. To assess whether the clicks that are coming to your site are qualified clicks, it helps to measure engagement.
Key engagement metrics include:
- Bounce rate: Bounce rate refers to the percentage of people who arrived at a page on your site (any page, not just the home page) and left without looking at another page. The lower your bounce rate, the better.
- Time on site: How long someone stays on your site on average. The longer someone stays on your site, the better, because that means they are likely reading more content, clicking to other pages, and taking interest.
- Number of pages viewed: The more pages people view, presumably, the higher their interest level.
Set up conversion events in Google Analytics
Traffic is great, engagement is even better, but conversions are the ultimate goal. The best evaluation of whether your SEO efforts are paying off lies in the measurement of whether people are taking action—whatever the action is that you prefer for a given page. For a degree or program page, the conversion event could be a request for more information. For an admissions page, it could the completion of an application. For an athletics page, it could be a form submission to a coach.
When you’re designing your conversions, consider both big and small goals. You want to measure the different steps along the journey toward enrollment, ones that require varying degrees of commitment. For example, video views or PDF downloads could be categorized as little conversions, whereas request for information submissions or applications would qualify as big. If you make the mistake of only setting up big conversion events in Google Analytics, you’ll lose out on valuable marketing insight about the key steps in the conversion process.
Conversion events for a college or university site could include:
- PDF downloads
- video views
- requests for more information
- form submissions
- sign-ups for open houses, info sessions, and campus tours
- emails to faculty and advisors
- applications
- registrations for classes
Michael Lofstead of Noel-Levitz also has some additional strategies for increasing landing page conversions.
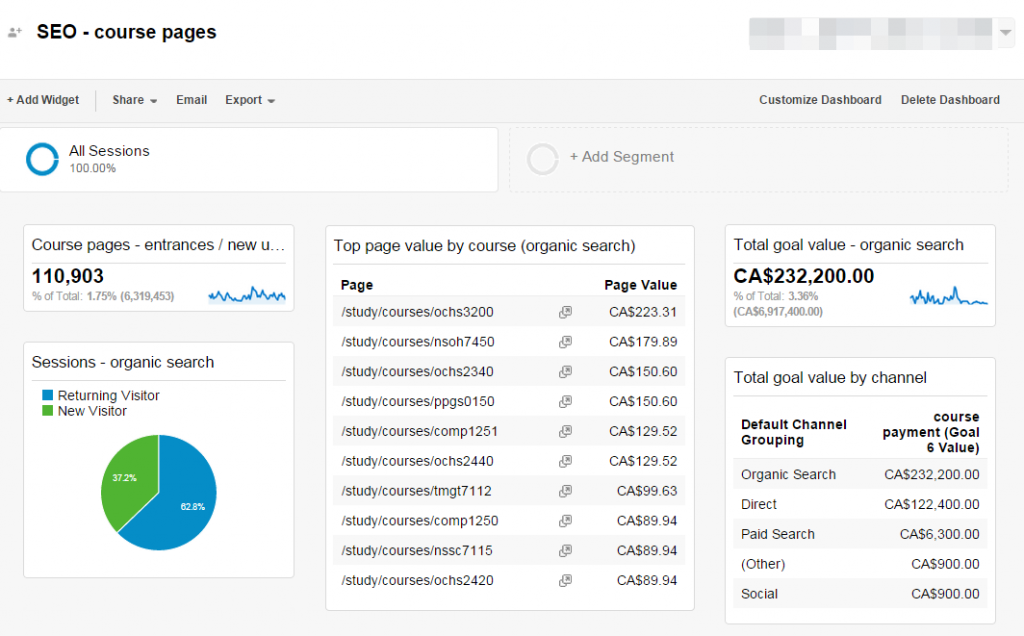
Create and share dashboards with others
No matter how committed you are to SEO, having the discipline to log into Google Analytics on a regular basis to pore over SEO stats can be a challenge, which is where dashboards come into play.
You can set up dashboards for almost any metric or combination of metrics, as many as 20 dashboards per account, with up to 12 widgets (reporting features) per dashboard. Dashboards can be viewed on screen or converted into PDFs and emailed on a pre-determined schedule to yourself and other people in your institution.
Including Google Analytics dashboards in your overall SEO plan can help make the invisible visible, translating your behind-the-scenes efforts into tangible numbers.
As a reminder, dashboards are simply data reports. They can show what’s happening (organic traffic is rising or falling, for example), but they can’t provide analysis as to why it’s happening. If you, or others, watch the dashboards on a regular basis, however, you can catch trends at their earliest stages and either capitalize on gains or track down and correct the causes of losses.
Want to explore college web analytics even more?
These strategies should produce immediate benefits for your campus, but the world of online analytics is a complicated one, and a subject many institutions struggle with. If you have any questions, please email me and I will reply back or arrange a time to talk. I can also provide a consultation over the phone with your and your colleagues, or provide a more detailed Digital Marketing Analysis.
Just remember that no SEO plan is complete without measurement mechanisms. If Google Analytics isn’t already loaded onto your institution’s website, push for it as a tool to support your SEO work. If you do have Google Analytics loaded, but haven’t been paying much attention to it, start taking advantage of its impressive tracking and reporting features. If you don’t know how to do that, ask me and I’ll be happy to help.