enrollment
Track conversion and yield rates for admissions more accurately with two new funnel metrics
Our new white paper, 7 Categories of Admissions Data to Guide Decision Making, discusses how your campus can use admissions data to make strategic decisions and measure and set institutional enrollment goals. Of the seven categories, historical trend data—including conversion and yield rates—play a major role when analyzing performance, identifying trends, and setting future goals.
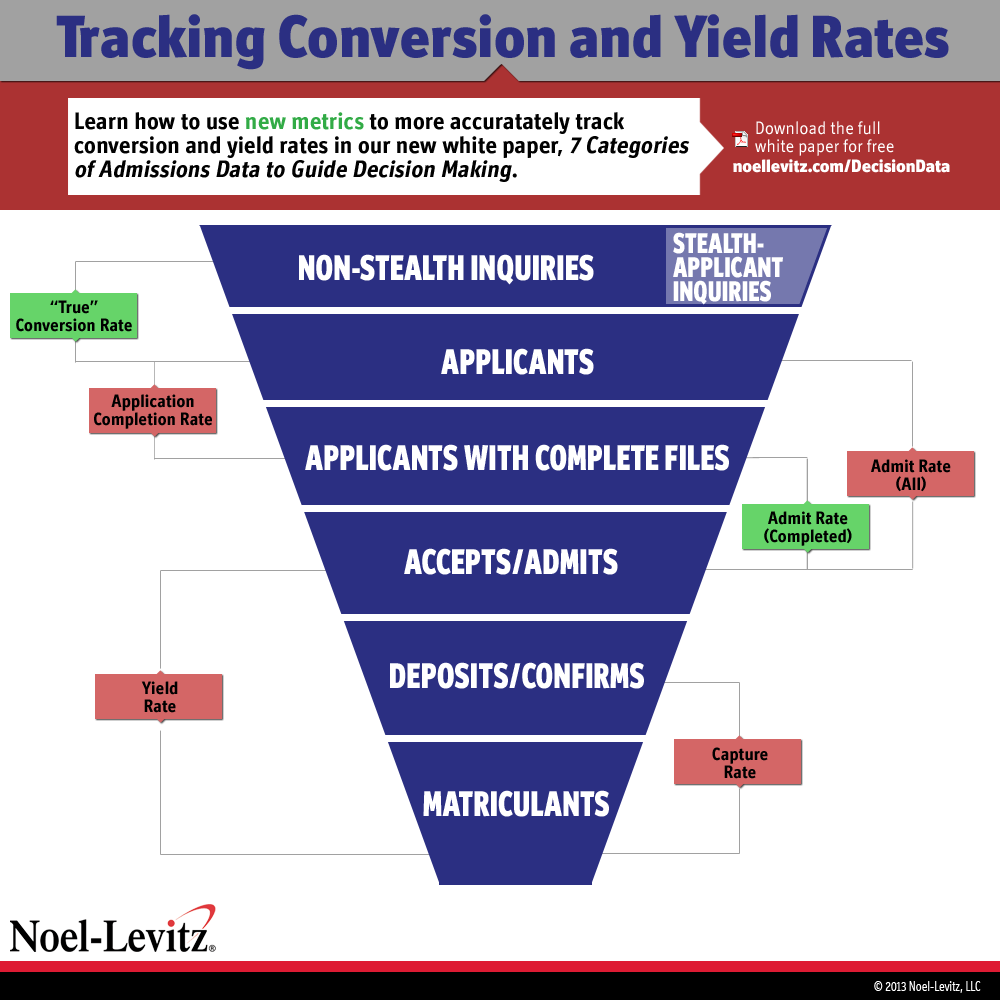
In its analysis of conversion and yield rates, the paper introduces two “new” metrics (pictured in green above) among the following seven measures of admissions funnel performance, which help to guide the recruitment, admissions, and enrollment process:
- Conversion rate: Inquiries -> Applicants (not pictured above)
- “True” conversion rate: Non-stealth applicant inquiries -> Applicants *NEW*
- Completion rate: Applicants -> Completed applicants
- Admit rate: Applicants -> Accepts/admits
- Completed application admit rate: Completed applicants -> Accepts/admits *NEW*
- Yield rate: Accepts/admits -> Matriculants
- Capture rate: Deposits/confirmed -> Matriculants
While each of these rates throughout the admissions process are informative, the two newer metrics offer especially revealing measurements that your campus should be using to guide decisions.
The “true” conversion rate on your campus removes stealth applicants (“secret shoppers”) to measure the number of formal inquiries who then convert into applicants. This rate may differ significantly from the traditional conversion rate measurement depending on the number of applicants who fail to inquire before submitting their applications.
Similarly, focusing on the admit rate of applicants who completed their files in comparison to the overall admit rate provides a more accurate measurement of an institution’s admit rate without including those who simply had incomplete files.
These historical trend metrics comprise just one of the seven categories of admissions data outlined in our new paper. Download a free copy to learn more about how these metrics and other data can help guide decisions on your campus.
If you have any questions about how to measure or use these—or other—admissions metrics, please send me an e-mail.